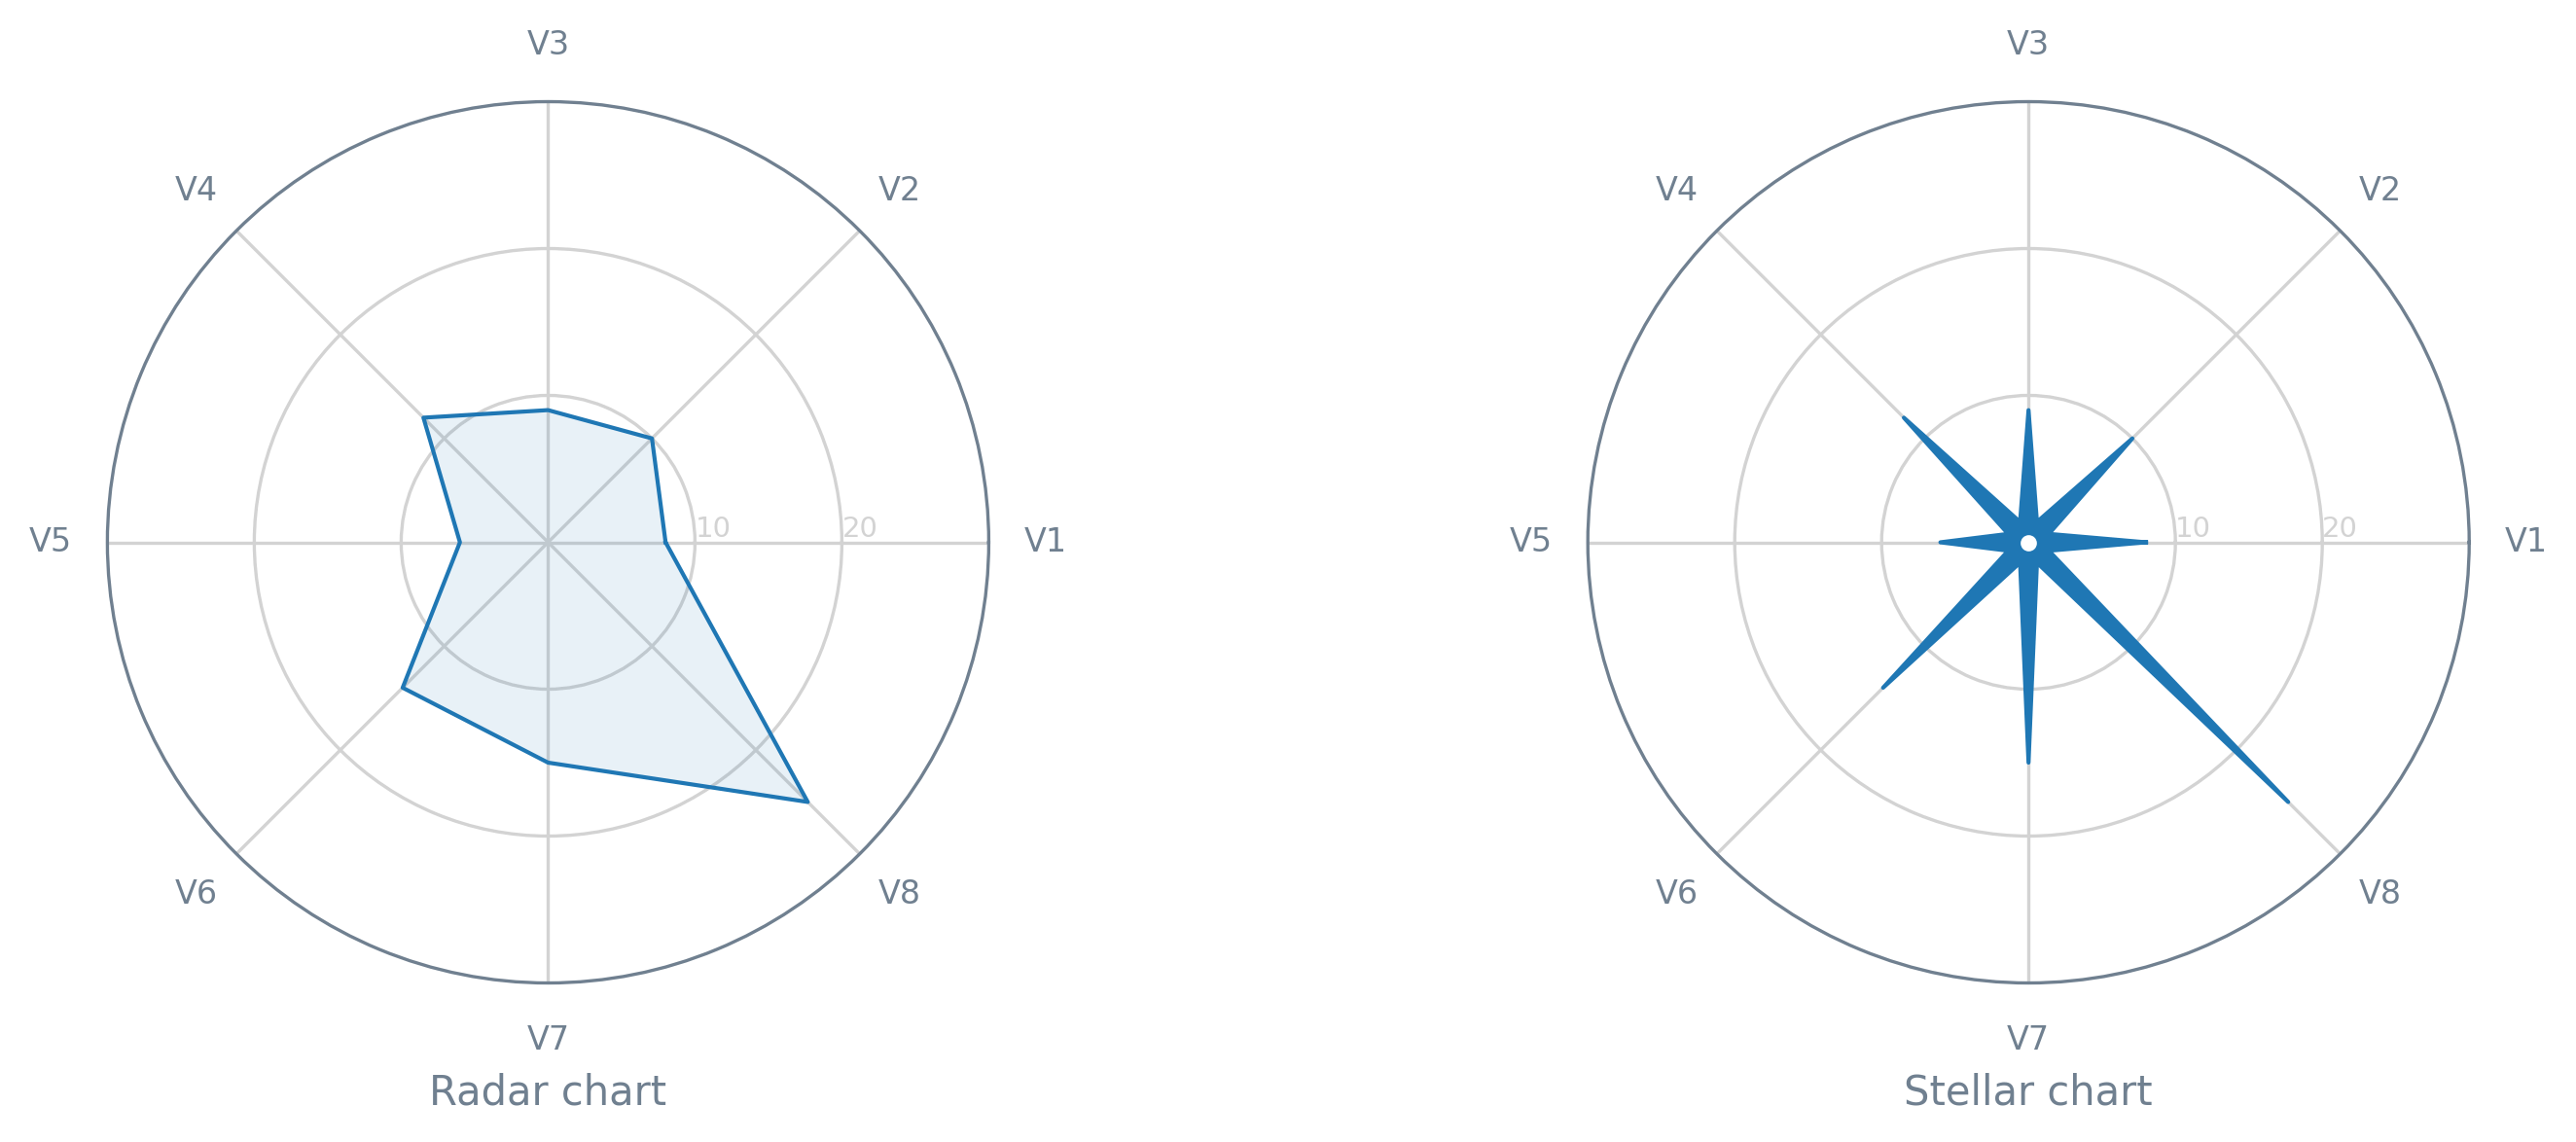
2020 年 5 月,Alexandre Morin-Chassé 发表了一篇关于**星形图**的博客文章。这种图表类型是**雷达图**(也称为网络图、蜘蛛图、星形图或蜘蛛网图)的(近似)直接替代方案——您可以在这里阅读有关该图表的更多信息。
在本教程中,我们将学习如何快速创建星形图。首先,让我们获取必要的模块/库,并准备一个虚拟数据集(仅包含一条记录)。
from itertools import chain, zip_longest
from math import ceil, pi

import matplotlib.pyplot as plt

data = [
    ("V1", 8),
    ("V2", 10),
    ("V3", 9),
    ("V4", 12),
    ("V5", 6),
    ("V6", 14),
    ("V7", 15),
    ("V8", 25),
]
我们还需要一些辅助函数,即一个向上舍入到最接近的 10 的函数(round_up())和一个连接两个序列的函数(even_odd_merge())。在后者中,第一个序列(列表或元组,基本上)的值将填充偶数位置,第二个序列的值将填充奇数位置。
def round_up(value):
    """
    >>> round_up(25)
    30
    """
    return int(ceil(value / 10.0)) * 10


def even_odd_merge(even, odd, filter_none=True):
    """
    >>> list(even_odd_merge([1,3], [2,4]))
    [1, 2, 3, 4]
    """
    if filter_none:
        return filter(None.__ne__, chain.from_iterable(zip_longest(even, odd)))

return chain.from_iterable(zip_longest(even, odd))也就是说,要在星形图上绘制data,我们需要应用一些转换,以及计算一些辅助值。因此,让我们从创建一个函数(prepare_angles())开始,以计算图表上每个轴的角度(N对应要绘制的变量数量)。
def prepare_angles(N):
    angles = [n / N * 2 * pi for n in range(N)]

    # Repeat the first angle to close the circle
    angles += angles[:1]

return angles接下来,我们需要一个函数(prepare_data()),负责调整原始数据(data)并将其分成几个易于使用的对象。
def prepare_data(data):
    labels = [d[0] for d in data]  # Variable names
    values = [d[1] for d in data]

    # Repeat the first value to close the circle
    values += values[:1]

    N = len(labels)
    angles = prepare_angles(N)

return labels, values, angles, N最后,对于这种特定类型的图表,我们需要一个函数(prepare_stellar_aux_data()),该函数根据之前计算的角度,准备两个辅助值列表:一个包含每对角度(stellar_angles)的**中间角度**列表,以及一个包含小**常数值**(stellar_values)列表,这些值将用作要绘制的变量的值,以实现星形图的**星形形状**。
def prepare_stellar_aux_data(angles, ymax, N):
    angle_midpoint = pi / N

    stellar_angles = [angle + angle_midpoint for angle in angles[:-1]]
    stellar_values = [0.05 * ymax] * N

    return stellar_angles, stellar_values
此时,我们已经拥有了创建星形图的所有必要**材料**,因此让我们继续进行本教程的 Matplotlib 部分。在**美观**方面,我们可以依靠一个为此特定目的设计的函数(draw_peripherals())(随意定制它!)。
def draw_peripherals(ax, labels, angles, ymax, outer_color, inner_color):
    # X-axis
    ax.set_xticks(angles[:-1])
    ax.set_xticklabels(labels, color=outer_color, size=8)

    # Y-axis
    ax.set_yticks(range(10, ymax, 10))
    ax.set_yticklabels(range(10, ymax, 10), color=inner_color, size=7)
    ax.set_ylim(0, ymax)
    ax.set_rlabel_position(0)

    # Both axes
    ax.set_axisbelow(True)

    # Boundary line
    ax.spines["polar"].set_color(outer_color)

    # Grid lines
    ax.xaxis.grid(True, color=inner_color, linestyle="-")
ax.yaxis.grid(True, color=inner_color, linestyle="-")要**绘制数据**并协调(几乎)所有创建星形图的必要步骤,我们只需要最后一个函数:draw_stellar()。
def draw_stellar(
    ax,
    labels,
    values,
    angles,
    N,
    shape_color="tab:blue",
    outer_color="slategrey",
    inner_color="lightgrey",
):
    # Limit the Y-axis according to the data to be plotted
    ymax = round_up(max(values))

    # Get the lists of angles and variable values
    # with the necessary auxiliary values injected
    stellar_angles, stellar_values = prepare_stellar_aux_data(angles, ymax, N)
    all_angles = list(even_odd_merge(angles, stellar_angles))
    all_values = list(even_odd_merge(values, stellar_values))

    # Apply the desired style to the figure elements
    draw_peripherals(ax, labels, angles, ymax, outer_color, inner_color)

    # Draw (and fill) the star-shaped outer line/area
    ax.plot(
        all_angles,
        all_values,
        linewidth=1,
        linestyle="solid",
        solid_joinstyle="round",
        color=shape_color,
    )

    ax.fill(all_angles, all_values, shape_color)

    # Add a small hole in the center of the chart
    ax.plot(0, 0, marker="o", color="white", markersize=3)
最后,让我们将图表放在一个**空白画布**(图)上。
fig = plt.figure(dpi=100)
ax = fig.add_subplot(111, polar=True)  # Don't forget the projection!

draw_stellar(ax, *prepare_data(data))

plt.show()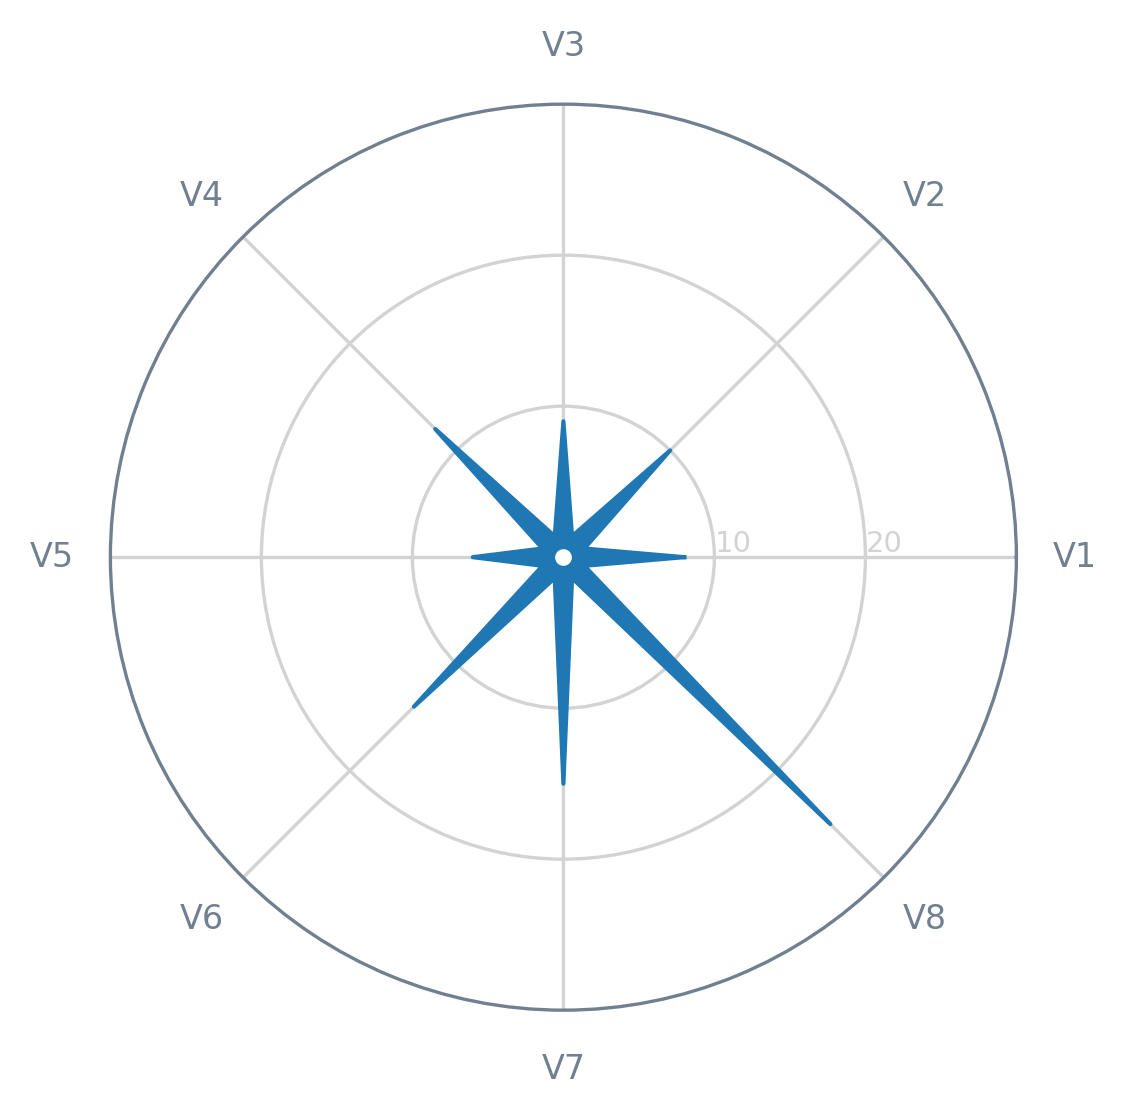
完成了!现在,您已经拥有了星形图的示例以及将这种类型的图表添加到您的**技能库**中的样板代码。如果您最终创建了自己的星形图,请随时与**全世界**(以及我!)分享!希望本教程对您有所帮助,也希望您喜欢它!