前几天我正在家教我的孩子,他们问我:“爸爸,你能帮我们画出所有可能的 3 个节点的非同构图吗?”或者是我问了他们?无论如何,我们很高兴地画出了所有可能的 3 个节点的图,但是对于 4 个节点,它就变得困难了,对于 5 个节点 - 根本不可能!
所以我想:让我尝试编写一个蛮力程序来完成它!我花了几小时来草拟一些智能动态规划解决方案来生成这些图,但没有得到任何结果,因为显然这个问题相当困难。我放弃了,决定采用一种朴素的方法
- 生成所有 N 个节点的图,即使其中一些看起来相同(同构)。对于 \(N\) 个节点,有 \(\frac{N(N-1)}{2}\) 条潜在的边可以连接这些节点,所以这就像生成一堆二进制数。简单!
- 编写一个程序来判断两个图是否同构,然后删除所有不需要出现在最终图片中的重复项。
这个策略看起来更合理,但是编写一个“图比较器”仍然感觉像是一项繁琐的任务,更重要的是,这部分本身也会很慢,因为我仍然需要遍历每个图比较的整个选项树。所以经过更多思考后,我决定进一步简化它,并利用如今内存便宜的事实
- 生成所有可能的图(其中一些完全同构,这意味着如果绘制在图形上,它们看起来会像重复)
- 对于每个图,生成其“描述”(例如邻接矩阵或边列表),并检查列表中是否已存在具有此描述的图。如果是,则跳过它,我们已经得到了它的图像!
- 但是,如果图是唯一的,则将其包含在图片中,并生成其所有可能的“描述”(直到节点排列),并将它们添加到哈希表中。以确保不会再将任何其他此特定形状的图包含在我们的漂亮图片中。
对于第一个任务,我使用了边列表,这使得任务与生成长度为 \(\frac{N(N-1)}{2}\) 的所有二进制数相同,使用递归函数,除了不写零之外,你跳过边,而不是写一,你包含它们。下面是执行此操作的函数,并且还有一个额外的好处,即以整洁有序的方式列出所有边。对于每条边 \(i \rightarrow j\) 我们都可以确定 \(i\) 小于 \(j\),并且边也按字典中的单词排序。这很好,因为它限制了可能的描述集,这将简化我们以后的生活。
def make_graphs(n=2, i=None, j=None):
    """Make a graph recursively, by either including, or skipping each edge.
    Edges are given in lexicographical order by construction."""
    out = []
    if i is None:  # First call
        out = [[(0, 1)] + r for r in make_graphs(n=n, i=0, j=1)]
    elif j < n - 1:
        out += [[(i, j + 1)] + r for r in make_graphs(n=n, i=i, j=j + 1)]
        out += [r for r in make_graphs(n=n, i=i, j=j + 1)]
    elif i < n - 1:
        out = make_graphs(n=n, i=i + 1, j=i + 1)
    else:
        out = [[]]
    return out
如果你对少量节点(例如 \(N=3\))运行此函数,你可以看到它如何生成所有可能的图拓扑,但其中一些描述实际上会导致相同的图片,如果绘制(下面列表中的图 2 和 3)。
[(0, 1), (0, 2), (1, 2)]
[(0, 1), (0, 2)]
[(0, 1), (1, 2)]
[(0, 1)]
此外,虽然从边构建图意味着我们永远不会得到孤独的未连接点,但我们可以得到小于 \(n\) 个节点的图(上面列表中的最后一个图),或者具有未连接部分的图。对于 \(n=3\) 这是不可能的,但从 \(n=4\) 开始,我们会得到像 [(0,1), (2,3)] 这样的东西,这在技术上是一个图,但你不能完全把它当作一件珠宝来佩戴,因为它会散架。所以在这一点上,我决定只可视化完全连接且恰好有 \(n\) 个顶点的图。
为了继续执行计划,我们现在需要创建一个函数,该函数对于每个图都会生成其“替代表示”族(考虑到我们生成器的约束),以确保重复项不会被忽视。首先我们需要一个排列函数,来排列节点(你也可以使用 numpy 中的内置函数,但是从头开始编写这个函数总是有趣的,不是吗?)。这是排列生成器
def perm(n, s=None):
    """All permutations of n elements."""
    if s is None:
        return perm(n, tuple(range(n)))
    if not s:
        return [[]]
    return [[i] + p for i in s for p in perm(n, tuple([k for k in s if k != i]))]
现在,对于任何给定的图描述,我们可以排列其节点,对每条边中的 \(i,j\) 进行排序,对边本身进行排序,删除重复的替代描述,并记住潜在的冒名顶替者列表
def permute(g, n):
    """Create a set of all possible isomorphic codes for a graph,
    as nice hashable tuples. All edges are i<j, and sorted lexicographically."""
    ps = perm(n)
    out = set([])
    for p in ps:
        out.add(
            tuple(sorted([(p[i], p[j]) if p[i] < p[j] else (p[j], p[i]) for i, j in g]))
        )
    return list(out)
例如,对于 [(0, 1), (0, 2)] 的输入描述,上面的函数返回三个“同义词”
((0, 1), (1, 2))
((0, 1), (0, 2))
((0, 2), (1, 2))
我怀疑应该有一种更简洁的方法来编写它,以避免使用 list → set → list 管道来去除重复项,但是,它确实有效!
在这一点上,唯一缺少的是检查图是否连通的函数,这恰好是一个著名的简洁算法,称为“并查集”。我不会在这里详细描述它,但简而言之,它遍历所有边并以特殊的方式将节点相互连接;然后计算最后剩下的单独的连通分量(例如,图块)的数量。如果所有节点都在一个块中,我们喜欢它。如果不是,我不想在我的图片中看到它!
def connected(g):
    """Check if the graph is fully connected, with Union-Find."""
    nodes = set([i for e in g for i in e])
    roots = {node: node for node in nodes}

    def _root(node, depth=0):
        if node == roots[node]:
            return (node, depth)
        else:
            return _root(roots[node], depth + 1)

    for i, j in g:
        ri, di = _root(i)
        rj, dj = _root(j)
        if ri == rj:
            continue
        if di <= dj:
            roots[ri] = rj
        else:
            roots[rj] = ri
    return len(set([_root(node)[0] for node in nodes])) == 1
现在我们终于可以生成“过度”图列表,对其进行过滤,并绘制图片了
def filter(gs, target_nv):
    """Filter all improper graphs: those with not enough nodes,
    those not fully connected, and those isomorphic to previously considered."""
    mem = set({})
    gs2 = []
    for g in gs:
        nv = len(set([i for e in g for i in e]))
        if nv != target_nv:
            continue
        if not connected(g):
            continue
        if tuple(g) not in mem:
            gs2.append(g)
            mem |= set(permute(g, target_nv))
    return gs2


# Main body
NV = 6
gs = make_graphs(NV)
gs = filter(gs, NV)
plot_graphs(gs, figsize=14, dotsize=20)
为了绘制图形,我为基于 MatPlotLib 的 NetworkX 可视化器编写了一个小包装器,使用 Matplotlib subplot 命令将图形拆分为许多小的方面。“Kamada-Kawai”布局下面是基于弹簧的布局的流行且快速的版本,它使图形看起来非常漂亮。
def plot_graphs(graphs, figsize=14, dotsize=20):
"""Utility to plot a lot of graphs from an array of graphs.
Each graphs is a list of edges; each edge is a tuple."""
n = len(graphs)
fig = plt.figure(figsize=(figsize, figsize))
fig.patch.set_facecolor("white") # To make copying possible (white background)
k = int(np.sqrt(n))
for i in range(n):
plt.subplot(k + 1, k + 1, i + 1)
g = nx.Graph() # Generate a Networkx object
for e in graphs[i]:
g.add_edge(e[0], e[1])
nx.draw_kamada_kawai(g, node_size=dotsize)
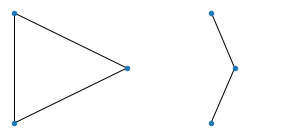
print(".", end="")以下是结果。为了增强期待感,让我们从一些简单的事情开始:所有 3 个节点的图
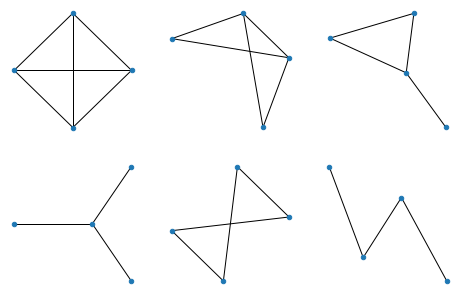
所有 4 个节点的图
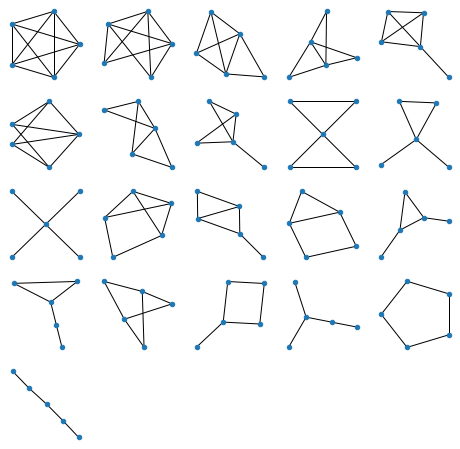
所有 5 个节点的图
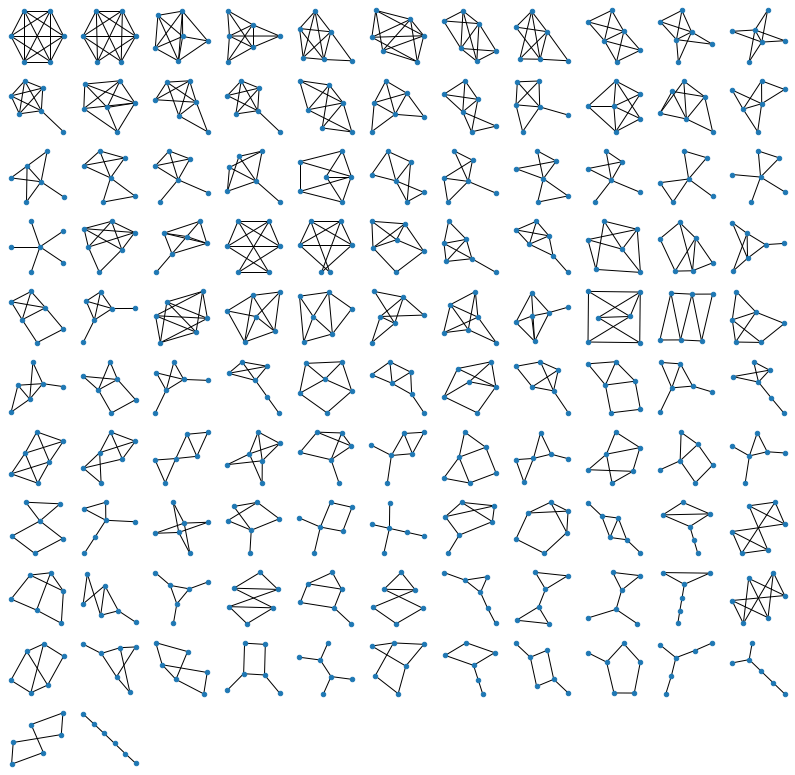
当然,在性能良好的计算机上生成上面的图形是即时的,但是对于 6 个节点(如下),它需要几秒钟
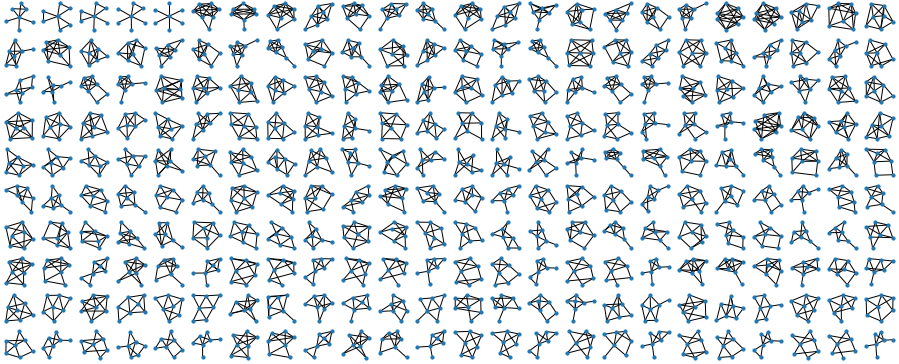
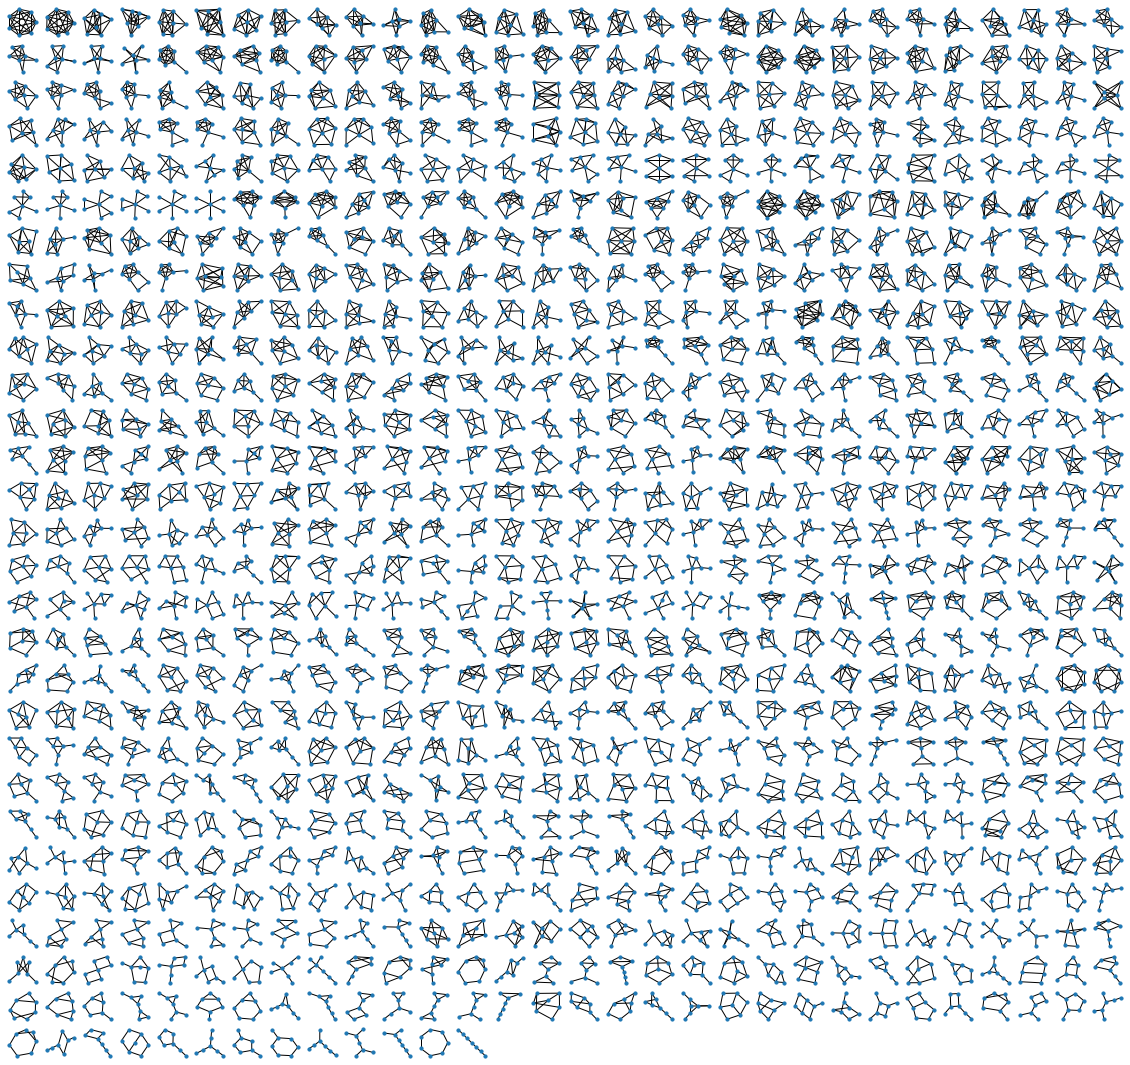
对于 7 个节点(如下),大约需要 5-10 分钟。很容易看出原因:蛮力方法生成所有 \(2^{\frac{n(n-1)}{2}}\) 个可能的图,这意味着操作数量呈指数增长!每次 \(n\) 增加 1,都会给我们 \(n-1\) 条新的边需要考虑,这意味着程序运行时间增加了 \(~2^{n-1}\)。对于 \(n=7\),它使我从几秒钟变成了几分钟,对于 \(n=8\),它会使我从几分钟变成了几小时,对于 \(n=9\),从几小时变成了几个月的计算。这很有趣吗?我们现在都是指数增长的专家,所以给你了 :)
代码作为我 GitHub 上的 Jupyter Notebook提供。我希望你喜欢这些图片和阅读!上面哪些饰品会带来好运?哪些似乎最适合占卜?请告诉我你的想法! :)