
我叫Ted Petrou,是Dunder Data的创始人,在本教程中,您将学习如何使用 Matplotlib 创建新的特斯拉 Cybertruck。我受到以下图片的启发,该图片最初由Lynn Fisher(未使用 Matplotlib)创建。
在详细介绍之前,让我们先看看结果。这是行驶出屏幕的特斯拉 Cybertruck 的完整重现。
教程#
现在将提供一个教程,其中包含创建会行驶的特斯拉 Cybertruck 的所有步骤。它涵盖以下主题
- 图形和坐标轴设置
- 添加形状
- 颜色渐变
- 动画
了解这些主题应该足以让你开始在 Matplotlib 中制作自己的动画图形。本教程不适合没有任何 Matplotlib 经验的人。您需要了解 Figure 和 Axes 之间的关系,以及如何使用 Matplotlib 的面向对象接口。
图形和坐标轴设置#
我们首先创建一个没有任何坐标轴(绘图表面)的 Matplotlib 图形。create_axes 函数向图形添加一个坐标轴,将 x 限制设置为 y 限制的两倍(以匹配图形尺寸(16 x 8)的比例),使用 fill_between 用两种不同的深色填充背景,并添加网格线以方便在您想要的确切位置绘制对象。当您想要删除网格线、刻度标记和刻度标签时,将 draft 参数设置为 False。
import numpy as np
import matplotlib.pyplot as plt

fig = plt.Figure(figsize=(16, 8))


def create_axes(draft=True):
    ax = fig.add_subplot()
    ax.grid(True)
    ax.set_ylim(0, 1)
    ax.set_xlim(0, 2)
    ax.fill_between(x=[0, 2], y1=0.36, y2=1, color="black")
    ax.fill_between(x=[0, 2], y1=0, y2=0.36, color="#101115")
    if not draft:
        ax.grid(False)
        ax.axis("off")


create_axes()
fig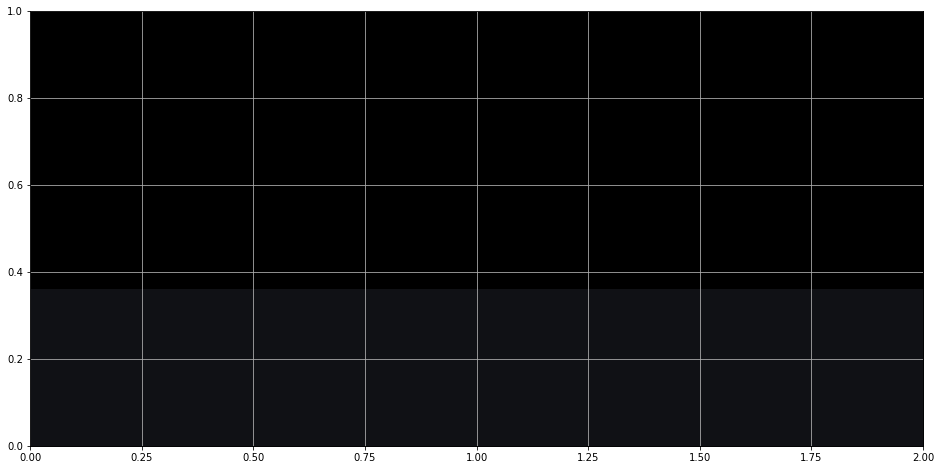
Matplotlib 中的形状#
Cybertruck 的大部分由形状(在 Matplotlib 术语中称为补丁)组成 - 圆形、矩形和多边形。这些形状在 patches Matplotlib 模块中可用。导入后,我们实例化这些补丁的单个实例,然后调用 add_patch 方法将补丁添加到坐标轴。
对于 Cybertruck,我使用了三个补丁,Polygon、Rectangle 和 Circle。它们的构造函数中都提供了不同的参数。我首先将汽车的车身构建为四个多边形。另外两个多边形用于轮辋。每个多边形都提供了一个 x、y 坐标列表,其中包含角点的坐标。Matplotlib 按给定的顺序连接所有点并用提供的颜色填充它。
请注意,如何将坐标轴作为函数的第一行检索。这在本教程中始终使用。
from matplotlib.patches import Polygon, Rectangle, Circle


def create_body():
    ax = fig.axes[0]
    top = Polygon([[0.62, 0.51], [1, 0.66], [1.6, 0.56]], color="#DCDCDC")
    windows = Polygon(
        [[0.74, 0.54], [1, 0.64], [1.26, 0.6], [1.262, 0.57]], color="black"
    )
    windows_bottom = Polygon(
        [[0.8, 0.56], [1, 0.635], [1.255, 0.597], [1.255, 0.585]], color="#474747"
    )
    base = Polygon(
        [
            [0.62, 0.51],
            [0.62, 0.445],
            [0.67, 0.5],
            [0.78, 0.5],
            [0.84, 0.42],
            [1.3, 0.423],
            [1.36, 0.51],
            [1.44, 0.51],
            [1.52, 0.43],
            [1.58, 0.44],
            [1.6, 0.56],
        ],
        color="#1E2329",
    )
    left_rim = Polygon(
        [
            [0.62, 0.445],
            [0.67, 0.5],
            [0.78, 0.5],
            [0.84, 0.42],
            [0.824, 0.42],
            [0.77, 0.49],
            [0.674, 0.49],
            [0.633, 0.445],
        ],
        color="#373E48",
    )
    right_rim = Polygon(
        [
            [1.3, 0.423],
            [1.36, 0.51],
            [1.44, 0.51],
            [1.52, 0.43],
            [1.504, 0.43],
            [1.436, 0.498],
            [1.364, 0.498],
            [1.312, 0.423],
        ],
        color="#4D586A",
    )
    ax.add_patch(top)
    ax.add_patch(windows)
    ax.add_patch(windows_bottom)
    ax.add_patch(base)
    ax.add_patch(left_rim)
    ax.add_patch(right_rim)


create_body()
fig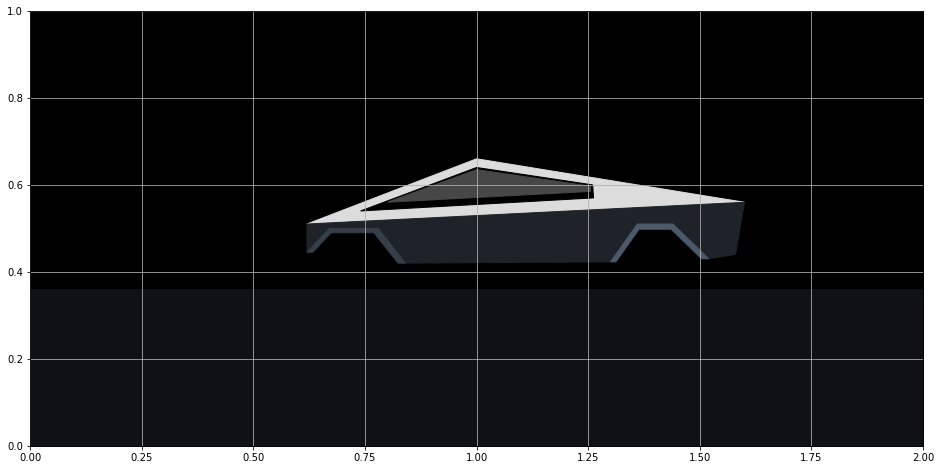
轮胎#
我为每个轮胎使用了三个 Circle 补丁。您必须提供中心和半径。对于最里面的圆圈(“辐条”),我已将 zorder 设置为 99。zorder 决定了绘图对象如何相互叠加的顺序。数字越大,对象在图层堆栈中的位置越高。在下一步中,我们将绘制一些穿过轮胎的矩形,并且需要将它们绘制在这些辐条下方。
def create_tires():
    ax = fig.axes[0]
    left_tire = Circle((0.724, 0.39), radius=0.075, color="#202328")
    right_tire = Circle((1.404, 0.39), radius=0.075, color="#202328")
    left_inner_tire = Circle((0.724, 0.39), radius=0.052, color="#15191C")
    right_inner_tire = Circle((1.404, 0.39), radius=0.052, color="#15191C")
    left_spoke = Circle((0.724, 0.39), radius=0.019, color="#202328", zorder=99)
    right_spoke = Circle((1.404, 0.39), radius=0.019, color="#202328", zorder=99)
    left_inner_spoke = Circle((0.724, 0.39), radius=0.011, color="#131418", zorder=99)
    right_inner_spoke = Circle((1.404, 0.39), radius=0.011, color="#131418", zorder=99)

    ax.add_patch(left_tire)
    ax.add_patch(right_tire)
    ax.add_patch(left_inner_tire)
    ax.add_patch(right_inner_tire)
    ax.add_patch(left_spoke)
    ax.add_patch(right_spoke)
    ax.add_patch(left_inner_spoke)
    ax.add_patch(right_inner_spoke)


create_tires()
fig
车轴#
我使用 Rectangle 补丁来表示穿过轮胎的两个“车轴”(这不是正确的术语,但您会明白我的意思)。您必须为左下角提供一个坐标、宽度和高度。您还可以为其提供一个角度(以度为单位)来控制其方向。请注意,它们位于上面绘制的辐条下方。这是由于它们的 zorder 较低。
def create_axles():
    ax = fig.axes[0]
    left_left_axle = Rectangle(
        (0.687, 0.427), width=0.104, height=0.005, angle=315, color="#202328"
    )
    left_right_axle = Rectangle(
        (0.761, 0.427), width=0.104, height=0.005, angle=225, color="#202328"
    )
    right_left_axle = Rectangle(
        (1.367, 0.427), width=0.104, height=0.005, angle=315, color="#202328"
    )
    right_right_axle = Rectangle(
        (1.441, 0.427), width=0.104, height=0.005, angle=225, color="#202328"
    )

    ax.add_patch(left_left_axle)
    ax.add_patch(left_right_axle)
    ax.add_patch(right_left_axle)
    ax.add_patch(right_right_axle)


create_axles()
fig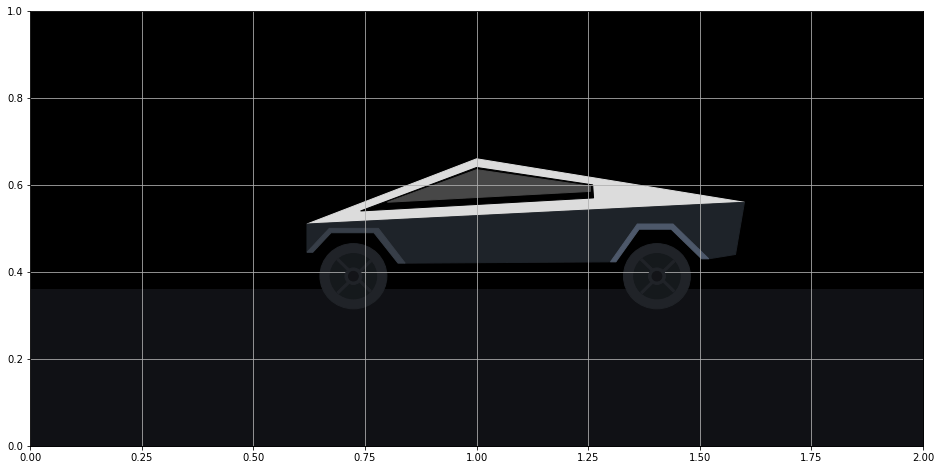
其他细节#
前保险杠、前灯、尾灯、车门和车窗线条在下面添加。我为其中一些使用了常规的 Matplotlib 线条。这些线条不是补丁,并且无需任何其他额外方法即可直接添加到坐标轴。
def create_other_details():
    ax = fig.axes[0]
    # other details
    front = Polygon(
        [[0.62, 0.51], [0.597, 0.51], [0.589, 0.5], [0.589, 0.445], [0.62, 0.445]],
        color="#26272d",
    )
    front_bottom = Polygon(
        [[0.62, 0.438], [0.58, 0.438], [0.58, 0.423], [0.62, 0.423]], color="#26272d"
    )
    head_light = Polygon(
        [[0.62, 0.51], [0.597, 0.51], [0.589, 0.5], [0.589, 0.5], [0.62, 0.5]],
        color="aqua",
    )
    step = Polygon(
        [[0.84, 0.39], [0.84, 0.394], [1.3, 0.397], [1.3, 0.393]], color="#1E2329"
    )

    # doors
    ax.plot([0.84, 0.84], [0.42, 0.523], color="black", lw=0.5)
    ax.plot([1.02, 1.04], [0.42, 0.53], color="black", lw=0.5)
    ax.plot([1.26, 1.26], [0.42, 0.54], color="black", lw=0.5)
    ax.plot([0.84, 0.85], [0.523, 0.547], color="black", lw=0.5)
    ax.plot([1.04, 1.04], [0.53, 0.557], color="black", lw=0.5)
    ax.plot([1.26, 1.26], [0.54, 0.57], color="black", lw=0.5)

    # window lines
    ax.plot([0.87, 0.88], [0.56, 0.59], color="black", lw=1)
    ax.plot([1.03, 1.04], [0.56, 0.63], color="black", lw=0.5)

    # tail light
    tail_light = Circle((1.6, 0.56), radius=0.007, color="red", alpha=0.6)
    tail_light_center = Circle((1.6, 0.56), radius=0.003, color="yellow", alpha=0.6)
    tail_light_up = Polygon(
        [[1.597, 0.56], [1.6, 0.6], [1.603, 0.56]], color="red", alpha=0.4
    )
    tail_light_right = Polygon(
        [[1.6, 0.563], [1.64, 0.56], [1.6, 0.557]], color="red", alpha=0.4
    )
    tail_light_down = Polygon(
        [[1.597, 0.56], [1.6, 0.52], [1.603, 0.56]], color="red", alpha=0.4
    )

    ax.add_patch(front)
    ax.add_patch(front_bottom)
    ax.add_patch(head_light)
    ax.add_patch(step)
    ax.add_patch(tail_light)
    ax.add_patch(tail_light_center)
    ax.add_patch(tail_light_up)
    ax.add_patch(tail_light_right)
    ax.add_patch(tail_light_down)


create_other_details()
fig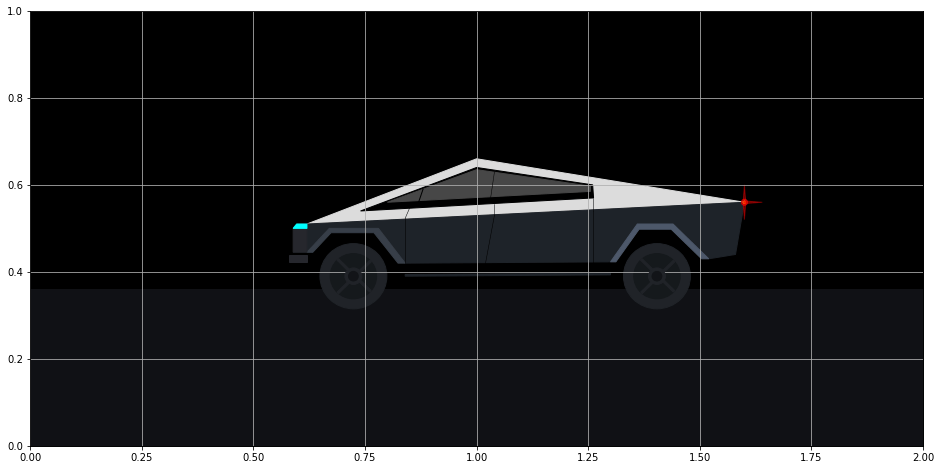
前灯光束的颜色渐变#
前灯光束具有独特的颜色渐变,逐渐消失在夜空中。这很难完成。我在 Stack Overflow 上找到了一个用户 Joe Kington 提供的绝佳答案,说明如何做到这一点。我们首先使用 imshow 函数,该函数从三维数组创建图像。我们的图像将只是一个颜色矩形。
我们创建一个 1 x 100 x 4 数组,它表示 1 行 100 列的 RGBA(红色、绿色、蓝色、alpha)值点。每个点都赋予相同的红色、绿色和蓝色值 (0, 1, 1),表示颜色“青绿色”。alpha 值表示不透明度,范围在 0 到 1 之间,其中 0 表示完全透明(不可见),1 表示不透明。我们希望随着灯光从前灯(即向左)延伸得越远,不透明度越低。NumPy 的 linspace 函数用于创建从 0 到 1 线性递增的 100 个数字的数组。此数组将设置为 alpha 值。
extent 参数定义了显示图像的矩形区域。四个值分别对应于 xmin、xmax、ymin 和 ymax。100 个 alpha 值将从左侧映射到此区域。alphas 数组从 0 开始,这意味着此矩形区域的最左侧将是透明的。不透明度将向矩形的右侧移动,最终达到 1。
import matplotlib.colors as mcolors


def create_headlight_beam():
    ax = fig.axes[0]
    z = np.empty((1, 100, 4), dtype=float)
    rgb = mcolors.colorConverter.to_rgb("aqua")
    alphas = np.linspace(0, 1, 100)
    z[:, :, :3] = rgb
    z[:, :, -1] = alphas
    im = ax.imshow(z, extent=[0.3, 0.589, 0.501, 0.505], zorder=1)


create_headlight_beam()
fig
前灯云#
围绕前灯光束的点云更难完成。这次,使用 100 x 100 点网格来控制不透明度。不透明度与距中心光束的垂直距离成正比。此外,如果某个点位于由 extent 定义的矩形的对角线之外,则其不透明度将设置为 0。
def create_headlight_cloud():
    ax = fig.axes[0]
    z2 = np.empty((100, 100, 4), dtype=float)
    rgb = mcolors.colorConverter.to_rgb("aqua")
    z2[:, :, :3] = rgb
    for j, x in enumerate(np.linspace(0, 1, 100)):
        for i, y in enumerate(np.abs(np.linspace(-0.2, 0.2, 100))):
            if x * 0.2 > y:
                z2[i, j, -1] = 1 - (y + 0.8) ** 2
            else:
                z2[i, j, -1] = 0
    im2 = ax.imshow(z2, extent=[0.3, 0.65, 0.45, 0.55], zorder=1)


create_headlight_cloud()
fig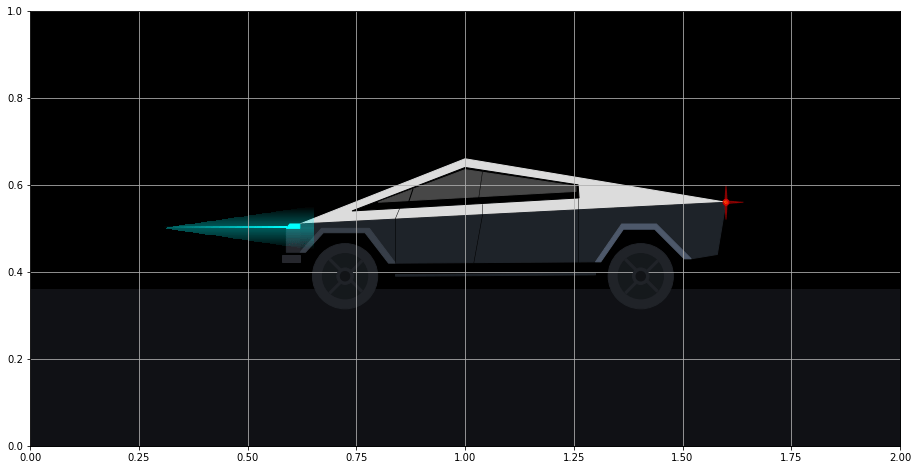
创建绘制汽车的函数#
我们上面完成的所有工作都可以放在一个绘制汽车的函数中。这将在初始化动画时使用。请注意,函数的第一行清除图形,这将删除我们的坐标轴。如果我们不清除图形,那么每次调用此函数时,我们将继续添加越来越多的坐标轴。由于这是我们的最终产品,因此我们将 draft 设置为 False。
def draw_car():
    fig.clear()
    create_axes(draft=False)
    create_body()
    create_tires()
    create_axles()
    create_other_details()
    create_headlight_beam()
    create_headlight_beam()


draw_car()
fig
动画#
Matplotlib 中的动画非常简单。您必须创建一个函数,用于更新图形中每个帧的对象位置。此函数将针对每个帧重复调用。
在下面的 update 函数中,我们循环遍历坐标轴中的每个补丁、线条和图像,并将每个绘制对象的 x 值减少 .015。这样可以使卡车向左移动。最棘手的部分是更改矩形轮胎“车轴”的 x 和 y 值,使其看起来轮胎在旋转。一些基本的三角函数有助于计算这一点。
隐式地,Matplotlib 将帧号作为整数作为第一个参数传递给更新函数。我们将其作为参数 frame_number 接受。我们只在一个地方使用它,那就是在第一帧中不执行任何操作。
最后,animation 模块中的 FuncAnimation 类用于构造动画。我们向其提供原始图形、更新图形的函数 (update)、初始化图形的函数 (draw_car)、帧总数以及更新期间使用的任何额外参数 (fargs)。
from matplotlib.animation import FuncAnimation


def update(frame_number, x_delta, radius, angle):
    if frame_number == 0:
        return
    ax = fig.axes[0]
    for patch in ax.patches:
        if isinstance(patch, Polygon):
            arr = patch.get_xy()
            arr[:, 0] -= x_delta
        elif isinstance(patch, Circle):
            x, y = patch.get_center()
            patch.set_center((x - x_delta, y))
        elif isinstance(patch, Rectangle):
            xd_old = -np.cos(np.pi * patch.angle / 180) * radius
            yd_old = -np.sin(np.pi * patch.angle / 180) * radius
            patch.angle += angle
            xd = -np.cos(np.pi * patch.angle / 180) * radius
            yd = -np.sin(np.pi * patch.angle / 180) * radius
            x = patch.get_x()
            y = patch.get_y()
            x_new = x - x_delta + xd - xd_old
            y_new = y + yd - yd_old
            patch.set_x(x_new)
            patch.set_y(y_new)

    for line in ax.lines:
        xdata = line.get_xdata()
        line.set_xdata(xdata - x_delta)

    for image in ax.images:
        extent = image.get_extent()
        extent[0] -= x_delta
        extent[1] -= x_delta


animation = FuncAnimation(
    fig, update, init_func=draw_car, frames=110, repeat=False, fargs=(0.015, 0.052, 4)
)保存动画#
最后,我们可以将动画保存为 mp4 文件(您必须安装 ffmpeg 才能使其工作)。我们将每秒帧数 (fps) 设置为 30。从上面看,帧总数为 110(足以使卡车驶出屏幕),因此视频将持续近四秒(110 / 30)。
animation.save("tesla_animate.mp4", fps=30, bitrate=3000)继续制作动画#
我鼓励您为 Cybertruck 动画添加更多组件以个性化创作。我建议像本教程中一样,将每个添加都封装在一个函数中。