引言#
代码切换是在单次对话中交替使用两种或多种语言的做法,无论是自觉还是不自觉。作为一个从小就说双语,目前还在学习其他语言的人,我发现代码切换不仅从纯粹的语言学角度,而且从社会学角度来看,都是交流的一个迷人方面。特别是,我个人发现代码切换通常有助于在群体中建立一种社区感和熟悉感,并且说话者彼此之间代码切换的独特方式极大地有助于塑造群体动态。
这在七人男子流行乐组合 WayV 中很明显。除了他们的音乐作品、艺术性和团队化学反应外,WayV 因其多语种和代码切换而闻名于粉丝和许多非粉丝,许多粉丝亲切地将其称为“WayV 语言”。该组合中的每个成员都精通普通话和韩语,并且该组合中至少有一名成员精通以下一种或多种语言:英语、粤语、泰语、温州话和德语。这是一个令人印象深刻的特点,已成为 WayV 的标志,因为他们自 2019 年 1 月出道以来迅速吸引了全球观众。他们的多语种也反映在他们的音乐中。除了以普通话发行的常规专辑外,WayV 还发行了韩语和英语单曲,他们最新的单曲“Bad Alive (English Ver.)”融合了英语、韩语和普通话。
作为一名将 WayV 内容翻译成英语的独立翻译,在与彼此沟通时,我敏锐地意识到 WayV 代码切换的真实程度和频率。在他们的很多内容中,WayV 每隔几秒钟就会频繁地在三种或更多语言之间切换,这种现象有时会使翻译颇具挑战性,但也极具回报和乐趣。我想以一种既能突出他们的语言技能,又能以更具体、定量和直观的方式呈现其群体动态这一维度的方式来呈现 WayV 的这一方面,而不仅仅是说“他们经常进行代码切换”。这促使我制作了阶梯图——非常适合显示在不规则间隔内发生变化但在变化之间保持不变的数据——希望丰富观看者的体验,并帮助使一个潜在的抽象概念更容易理解和更容易获取。通过阶梯图,观看者可以更清楚地了解一个群体如何交流,并且图表的横截面可以初步了解多语种人士如何在代码切换中互相影响。
教程#
本教程以 WayV 的一个直播为例,介绍如何创建阶梯图。在这个直播中,有四名成员,总共使用了八种语言/方言。我将逐步介绍如何创建阶梯图,该图描绘了其中一名成员代码切换的频率。在接近末尾的地方,可以找到一个完整的代码块,该代码块展示了如何在同一个图表中分层绘制两条或更多阶梯图线条,以描绘多名成员的代码切换情况。
数据集#
首先,我们导入所需的库并将数据加载到 Pandas 数据框中。
import pandas as pd
import matplotlib.pyplot as plt
import seaborn as sns
此数据集包含每个切换的时间戳(以秒为单位)和一个说话者的切换语言。
df_h = pd.read_csv("WayVHendery.csv")
HENDERY = df_h.reset_index()
HENDERY.head()
| 索引 | 时间 | 语言 |
|---|---|---|
| 0 | 2 | 英语 |
| 1 | 3 | 韩语 |
| 2 | 10 | 英语 |
| 3 | 13 | 普通话 |
| 4 | 15 | 英语 |
绘图#
加载数据集后,我们现在可以设置图表的尺寸、dpi、字体大小和轴限制。我们还可以调整美观性,例如修改绘图的颜色。这几个简单的步骤可以轻松地将默认的全白色图表转换为更具视觉吸引力的图表。
无自定义#
fig, ax = plt.subplots(figsize = (20,12))
![An all-white graph with the x and y axis defined on the range [0, 1].](/matplotlib/codeswitching-visualization/fig1.png)
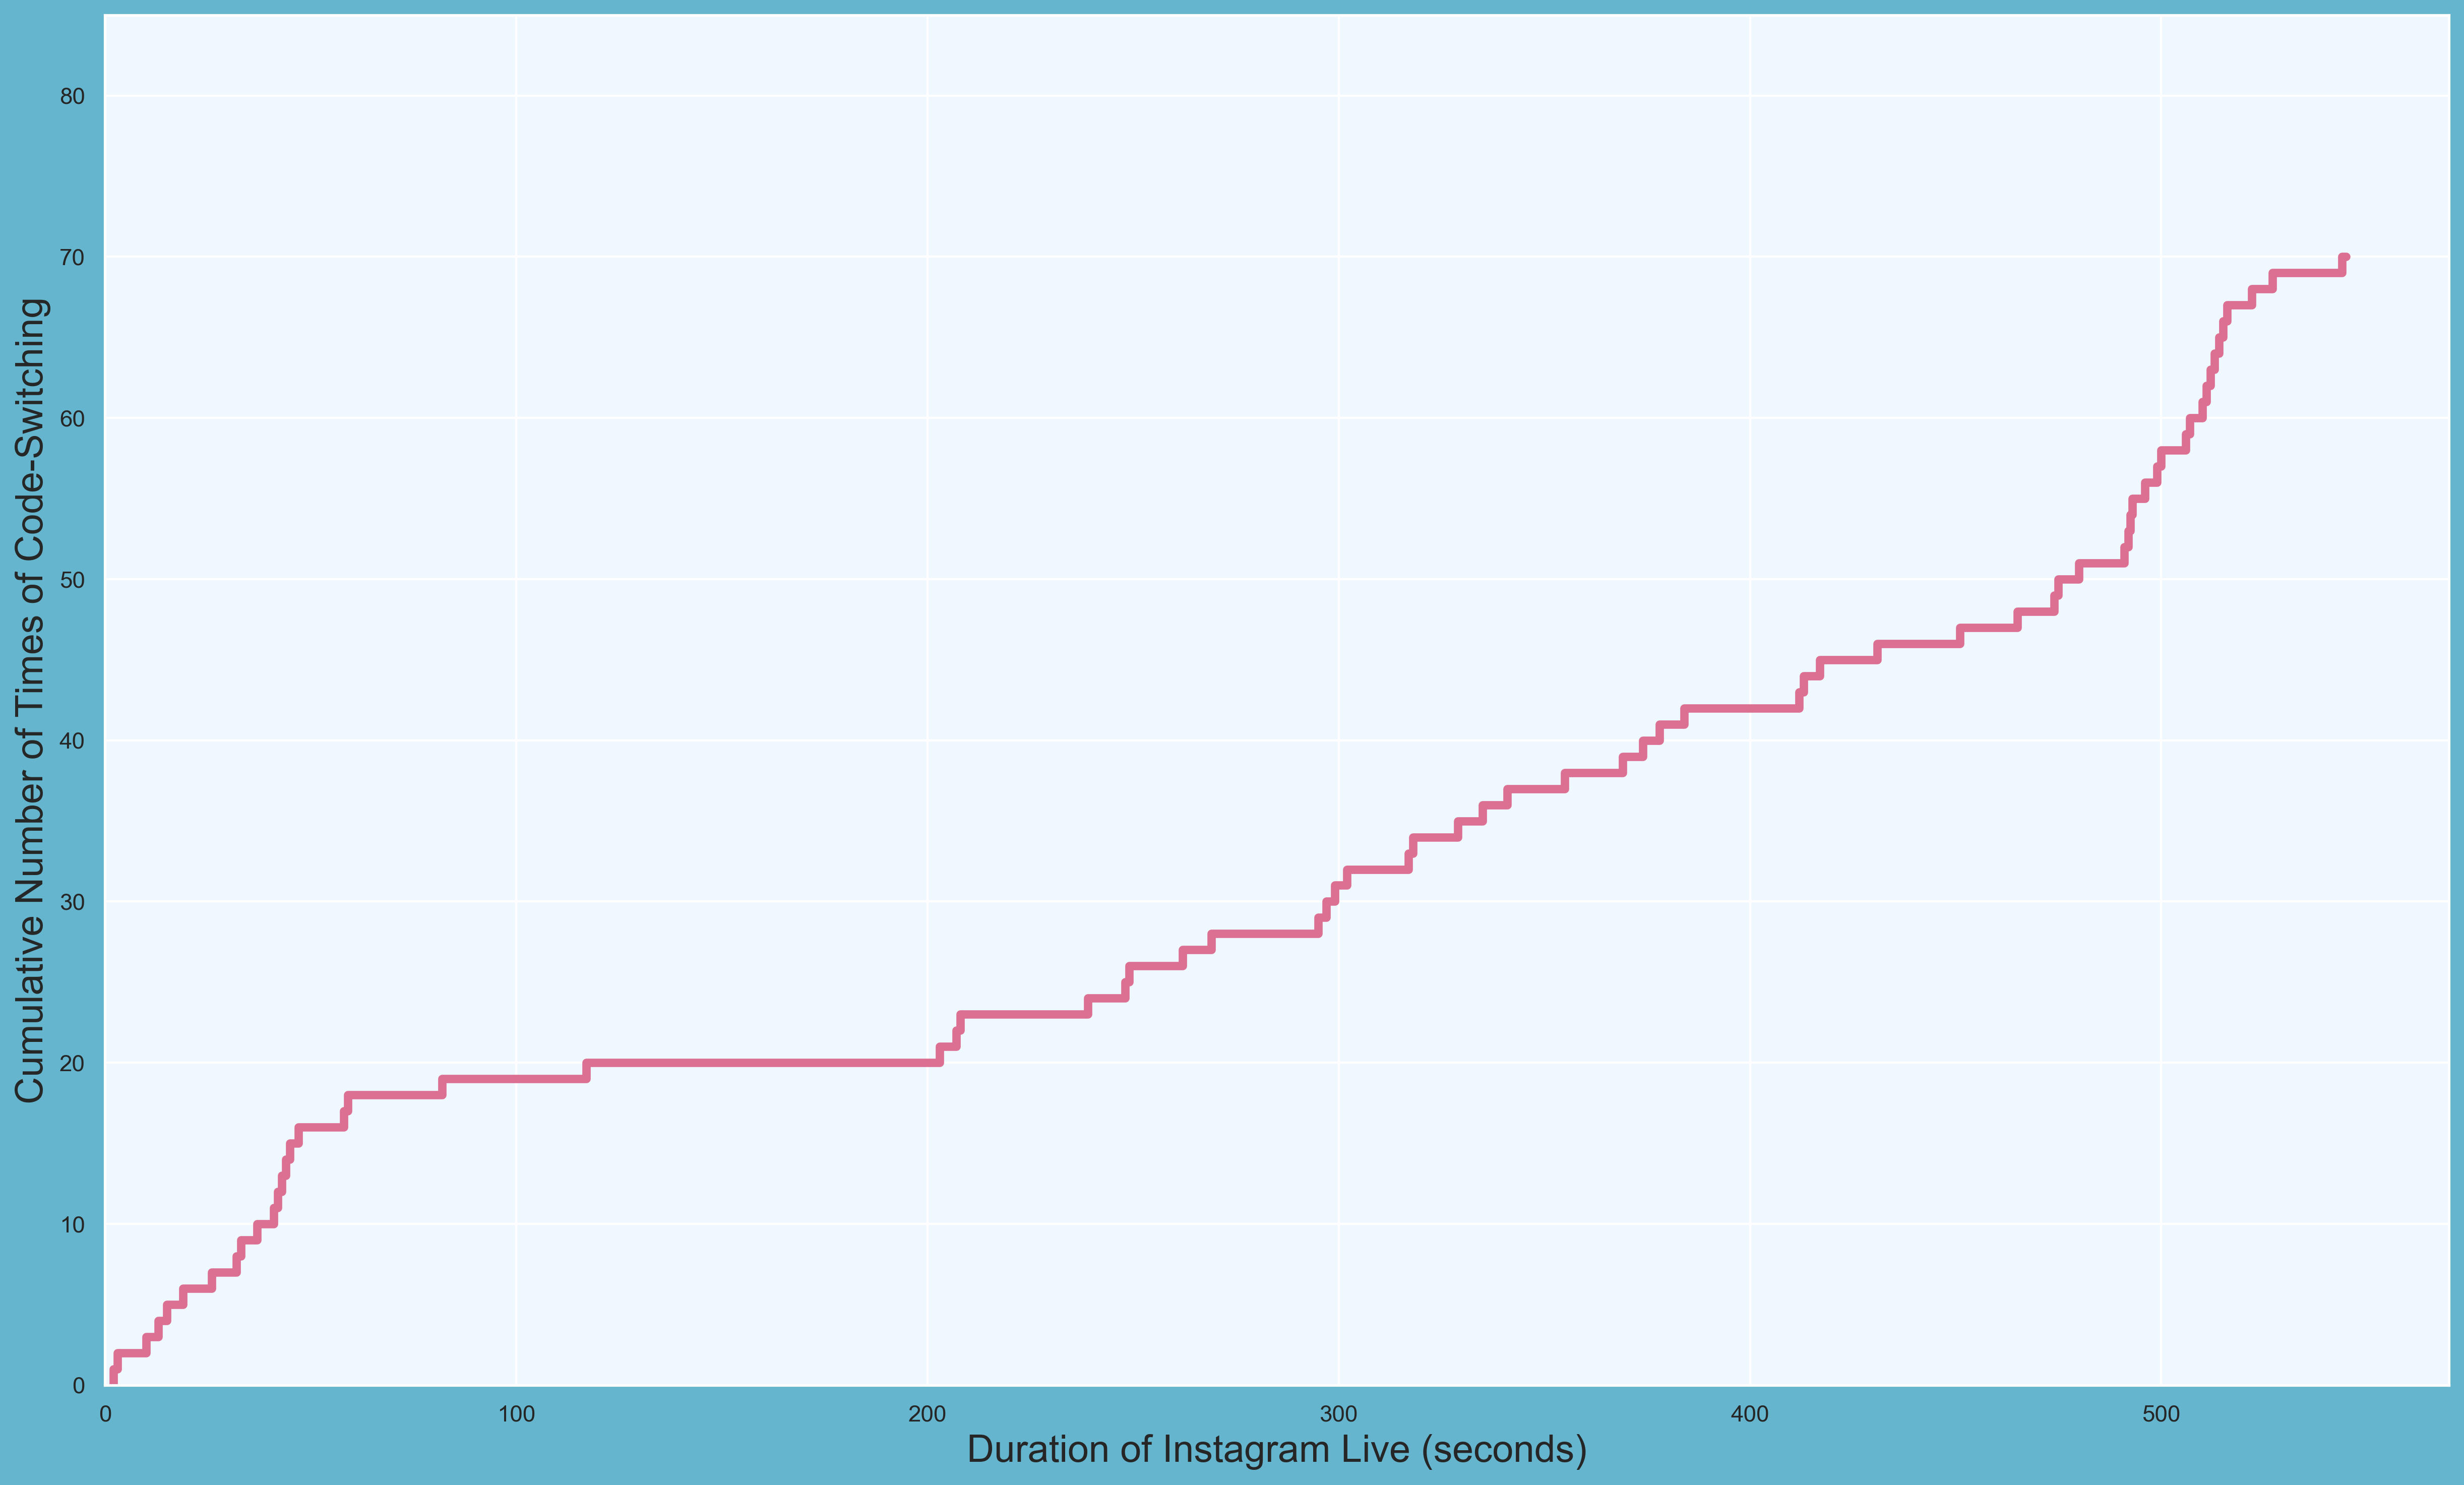
有自定义#
sns.set(rc={'axes.facecolor':'aliceblue', 'figure.facecolor':'c'})
fig, ax = plt.subplots(figsize = (20,12), dpi = 300)

plt.xlabel("Duration of Instagram Live (seconds)", fontsize = 18)
plt.ylabel("Cumulative Number of Times of Code-Switching", fontsize = 18)

plt.xlim(0, 570)
plt.ylim(0, 85)
接下来,我们可以使用 matplotlib.pyplot.step 轻松创建阶梯图线条,在其中绘制 x 和 y 值,并确定图例文本、阶梯图线条的颜色和阶梯图线条的宽度。
ax.step(HENDERY.time, HENDERY.index, label = "HENDERY", color = "palevioletred", linewidth = 4)
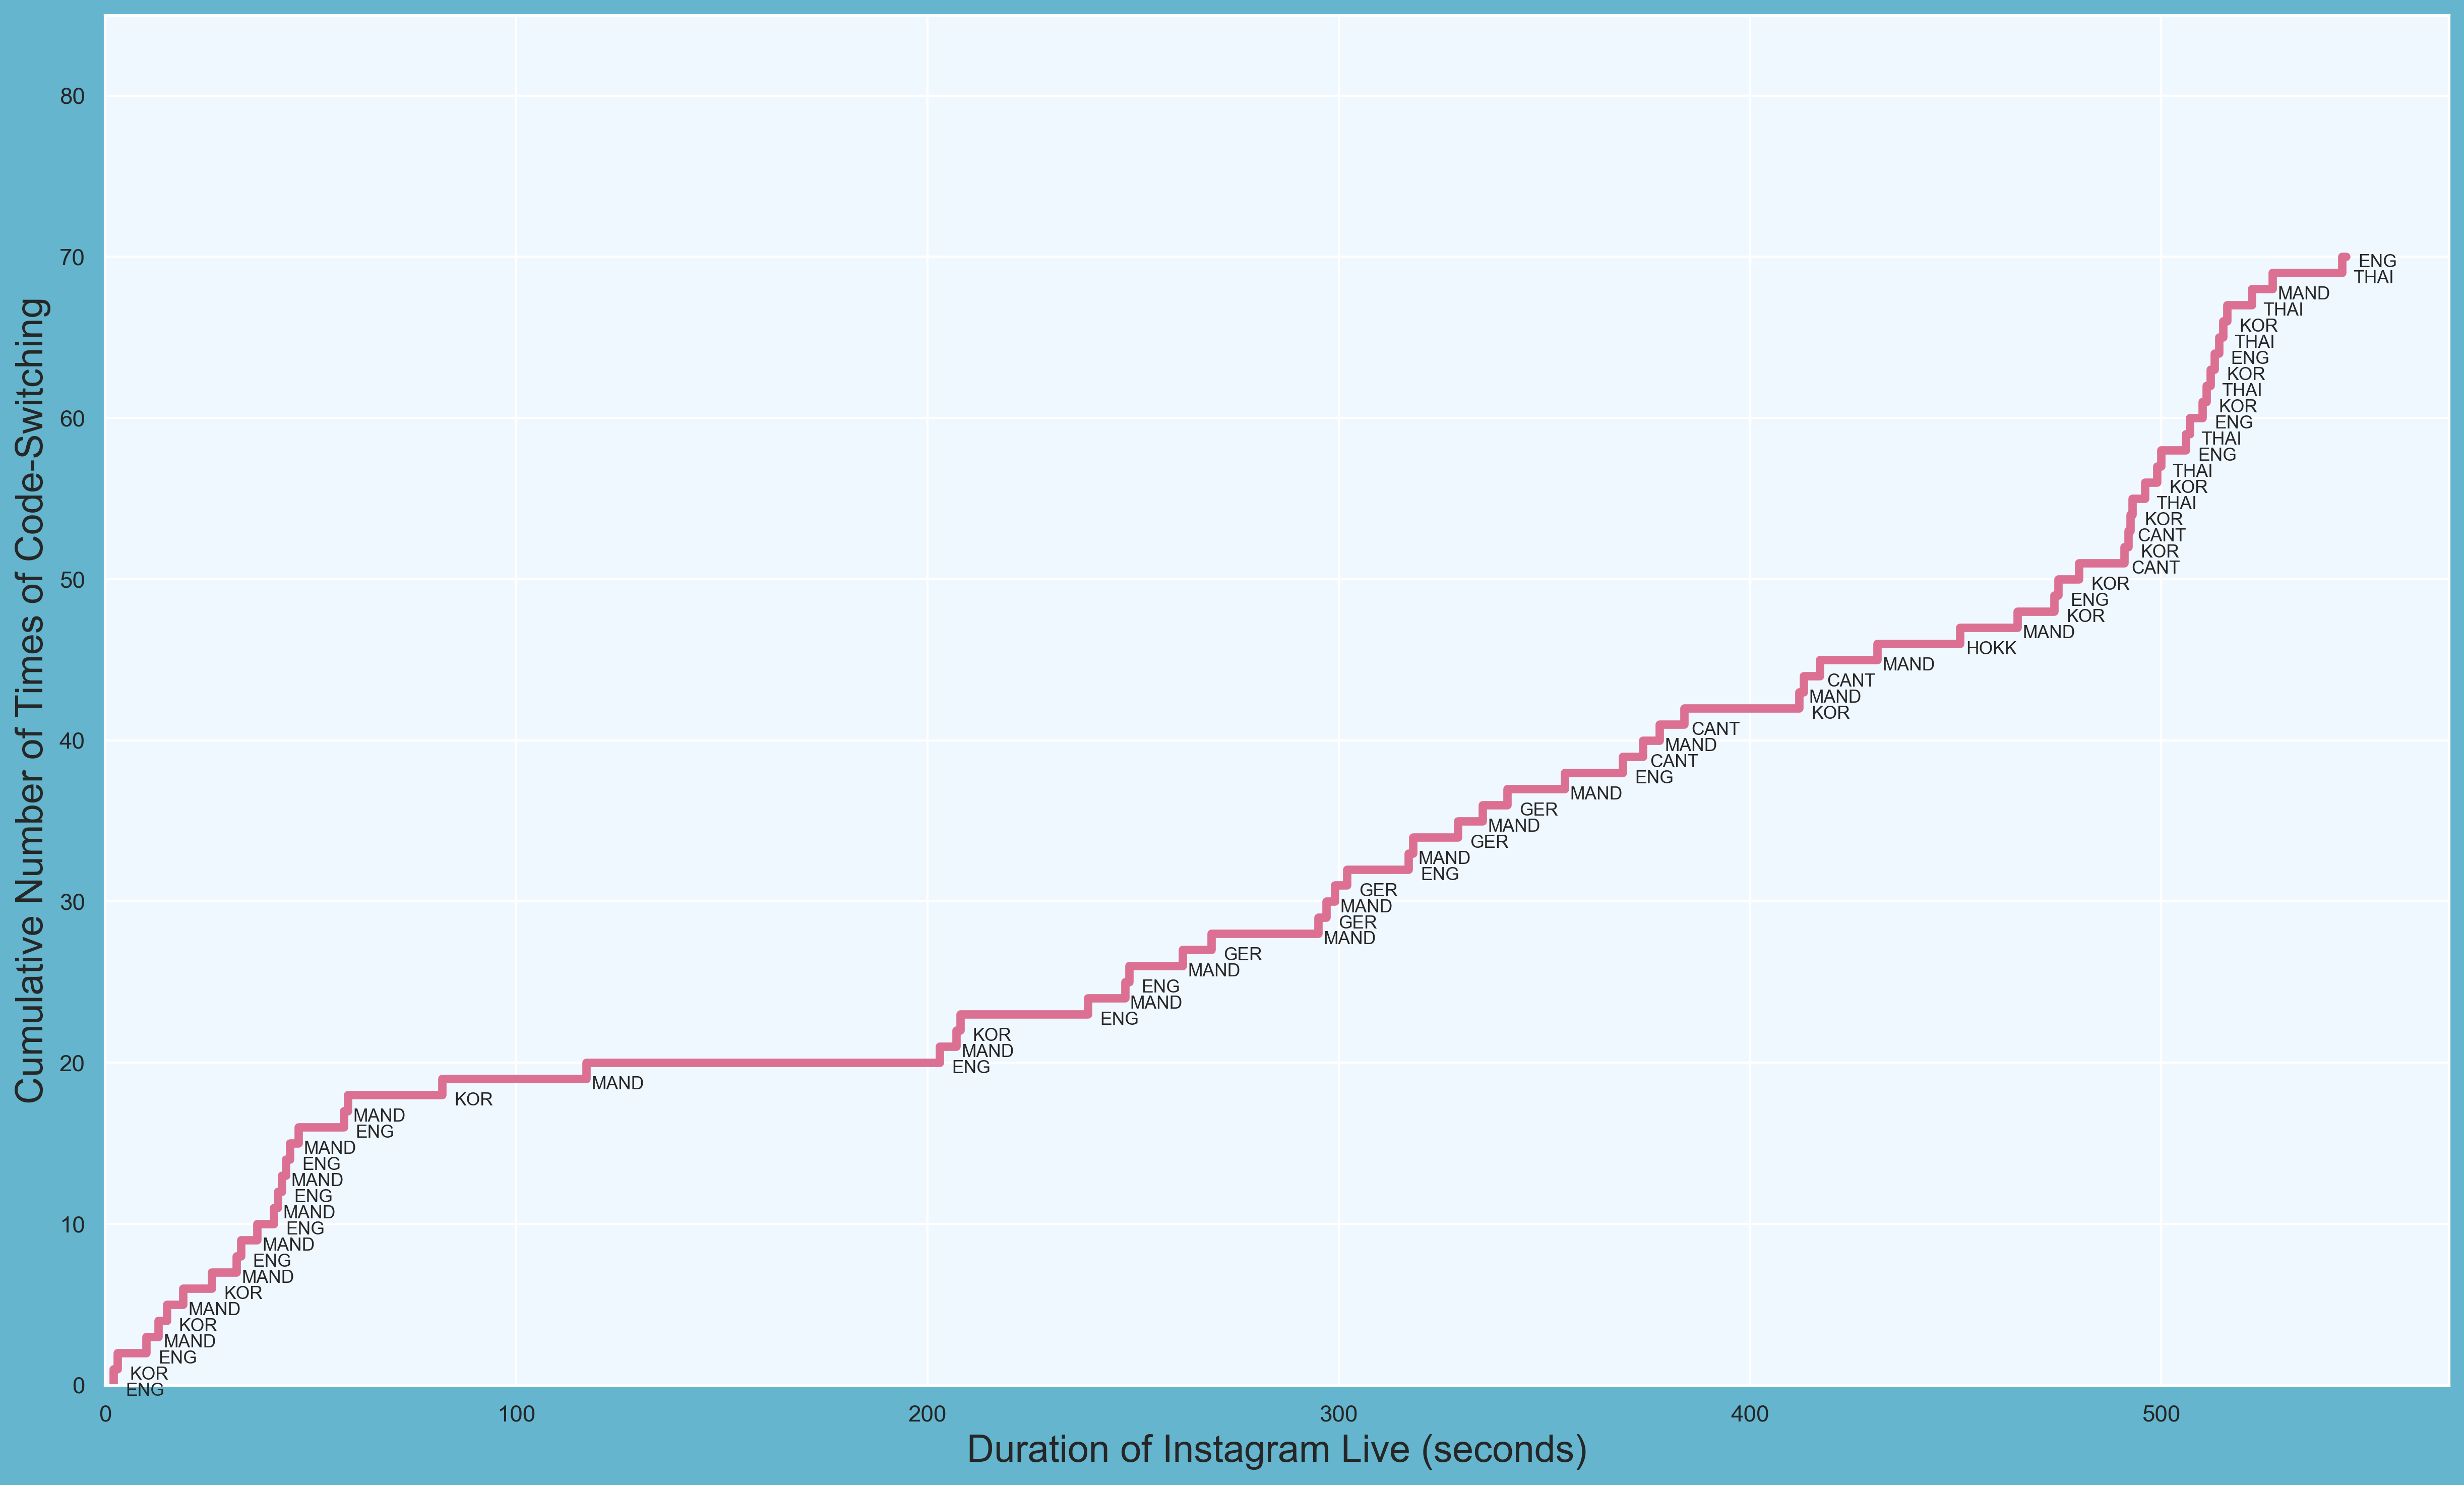
标签#
当然,我们不仅想知道有多少次切换以及何时发生,还想知道成员切换到了哪种语言。为此,我们可以编写一个 for 循环,用我们数据集中记录的相应语言标记每个切换。
for x,y,z in zip(HENDERY["time"], HENDERY["index"], HENDERY["lang"]):
    label = z
    ax.annotate(label, #text
                 (x,y), #label coordinate
                 textcoords = "offset points", #how to position text
                 xytext = (15,-5), #distance from text to coordinate (x,y)
                 ha = "center", #alignment
                 fontsize = 8.5) #font size of text
最后润色#
现在添加标题,保存图表,搞定!
plt.title("WayV Livestream Code-Switching", fontsize = 35)

fig.savefig("wayv_codeswitching.png", bbox_inches = "tight", facecolor = fig.get_facecolor())
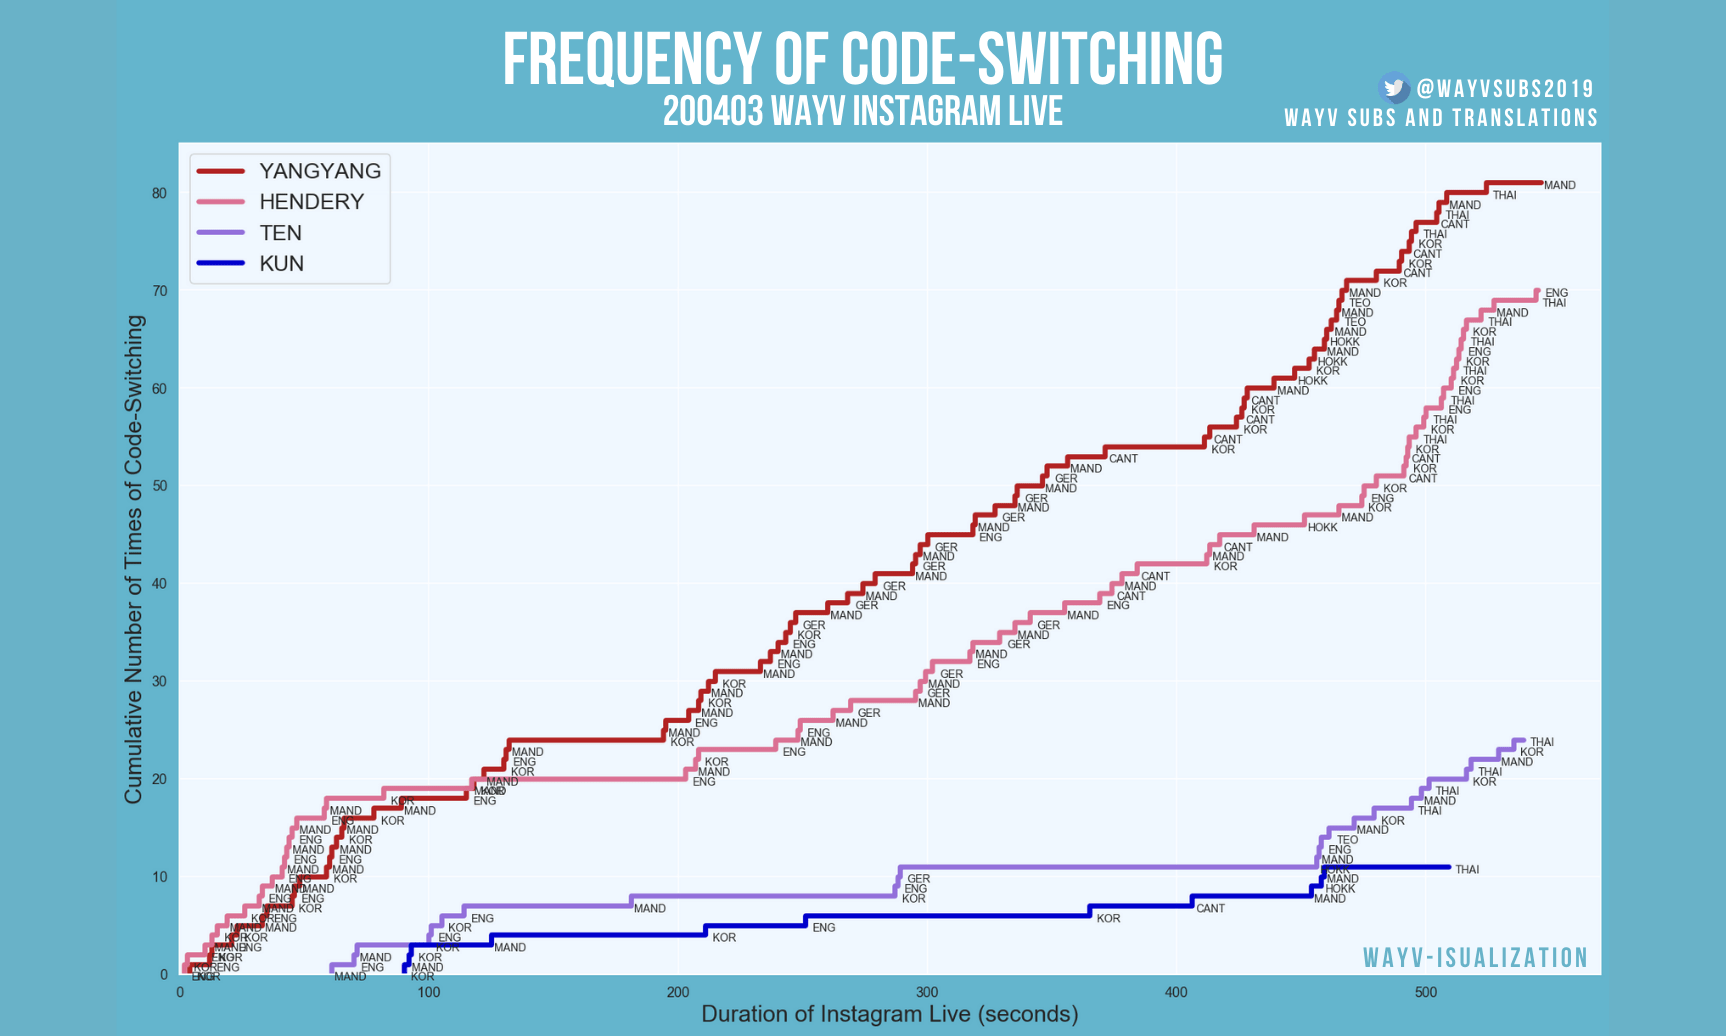
以下是将多个说话者的阶梯图线条分层绘制在一个图表中的完整代码。您可以看到,获取可视化一个说话者代码切换的代码并将其应用于可视化多个说话者的代码切换是多么容易。此外,您可以看到,我故意留空了标题,以便在使用 Matplotlib 创建图表后,我可以合并外部图形调整,例如添加我的社交媒体句柄和使用我想要的特定字体,您可以在最终图表中看到这一点。由于可视化旨在传达信息,我相信将 Matplotlib 与简单的图形设计元素结合起来,可以是使您演示的内容更有效和更个性化的另一种方式,尤其是在社交媒体平台上进行演示时。
多个说话者的阶梯图完整代码#
# Initialize graph color and size
sns.set(rc={'axes.facecolor':'aliceblue', 'figure.facecolor':'c'})

fig, ax = plt.subplots(figsize = (20,12), dpi = 120)

# Set up axes and labels
plt.xlabel("Duration of Instagram Live (seconds)", fontsize = 18)
plt.ylabel("Cumulative Number of Times of Code-Switching", fontsize = 18)

plt.xlim(0, 570)
plt.ylim(0, 85)

# Layer step charts for each speaker
ax.step(YANGYANG.time, YANGYANG.index, label = "YANGYANG", color = "firebrick", linewidth = 4)
ax.step(HENDERY.time, HENDERY.index, label = "HENDERY", color = "palevioletred", linewidth = 4)
ax.step(TEN.time, TEN.index, label = "TEN", color = "mediumpurple", linewidth = 4)
ax.step(KUN.time, KUN.index, label = "KUN", color = "mediumblue", linewidth = 4)

# Add legend
ax.legend(fontsize = 17)

# Label each data point with the language switch
for i in (KUN, TEN, HENDERY, YANGYANG): #for each dataset
    for x,y,z in zip(i["time"], i["index"], i["lang"]): #looping within the dataset
        label = z
        ax.annotate(label, #text
                     (x,y), #label coordinate
                     textcoords = "offset points", #how to position text
                     xytext = (15,-5), #distance from text to coordinate (x,y)
                     ha = "center", #alignment
                     fontsize = 8.5) #font size of text

# Add title (blank to leave room for external graphics)
plt.title("\n\n", fontsize = 35)

# Save figure
fig.savefig("wayv_codeswitching.png", bbox_inches = "tight", facecolor = fig.get_facecolor())
语言/方言:韩语 (KOR)、英语 (ENG)、普通话 (MAND)、德语 (GER)、粤语 (CANT)、闽南语 (HOKK)、潮州话 (TEO)、泰语 (THAI)
共 186 次切换!大约每 2.95 秒切换一次。
就是这样!这就是一份关于如何制作阶梯图的简要指南。虽然我在这里使用阶梯图来可视化代码切换,但您可以使用它们来可视化任何您想要的数据。如果您有任何疑问或意见,请随时与我联系。希望您喜欢本教程,非常感谢您的阅读!